
15,120. That’s the number of characters I tweeted out in 2016 through my user account (@michaelpsweeney).
Well, 15,120, give or take. My estimate might be off because Twitter famously changed the platform in the summer. User handles and links that people type into their tweets no longer count towards the 140-character limit (but social sharing widgets will still count your keystrokes down to zero from 140). That means that one of my best performing tweets consists of a single emoji (another capability that Twitter added in 2016).
@bmosherzinck @mobile @diginomica 🙂 pic.twitter.com/YBjxyW0qgd
— Michael Sweeney CPSM (@michaelpsweeney) May 13, 2016
CH-CH-CH-CH-CHANGES!: Twitter in 2016
Twitter made a lot of headlines in 2016 — so many, in fact, that you might have missed that it turned 10 years old on March 21rst! Twitter shut down its Vine acquisition, introduced a Go Live feature in December with partner Periscope, and included photos and other media into its news feed.
Twitter cracked down on abusers, but high-profile victims of trolling, like Ghostbusters star Leslie Jones, closed their accounts. Presidential candidate Donald Trump put Twitter at the center of his campaign from the beginning, and was acclaimed by the New York Times for mastering the platform all the way back in 2015.
Twitter’s activity has grown over 20% every year since 2014. This growth and change, plus my own increased output, caused me to look more closely at the past year’s tweets to see what is working, and how great of an effect it has on my marketing goals.
Tweaking Our Strategy for 2017
I use Twitter mainly to bookmark (and share) interesting articles. There’s a lot I don’t do, and still more that I don’t know, but as the platform is constantly evolving, and the user base is expanding, the number and variety of one-to-one communications are increasing, and the rate and volume of activity is growing on the whole. All of these factors contribute to changes in the platform, which in turn feed back into (and modify) individual Twitter users’ actions.
You can view your tweets and associated statistics for each one in Twitter’s Analytics screen. These statistics include: impressions (the number of views), engagements (the sum of all actions taken), and the engagement rate (engagements divided by impressions — usually a depressingly minuscule number). There are 7 types of engagement actions Twitter tallies. They are: retweets, replies, likes, user profile clicks, url clicks, hashtag clicks, and detail-expansions. Some of these are more significant than others, but it’s rather difficult to figure this out.
A better way to see it; a better way to show it.
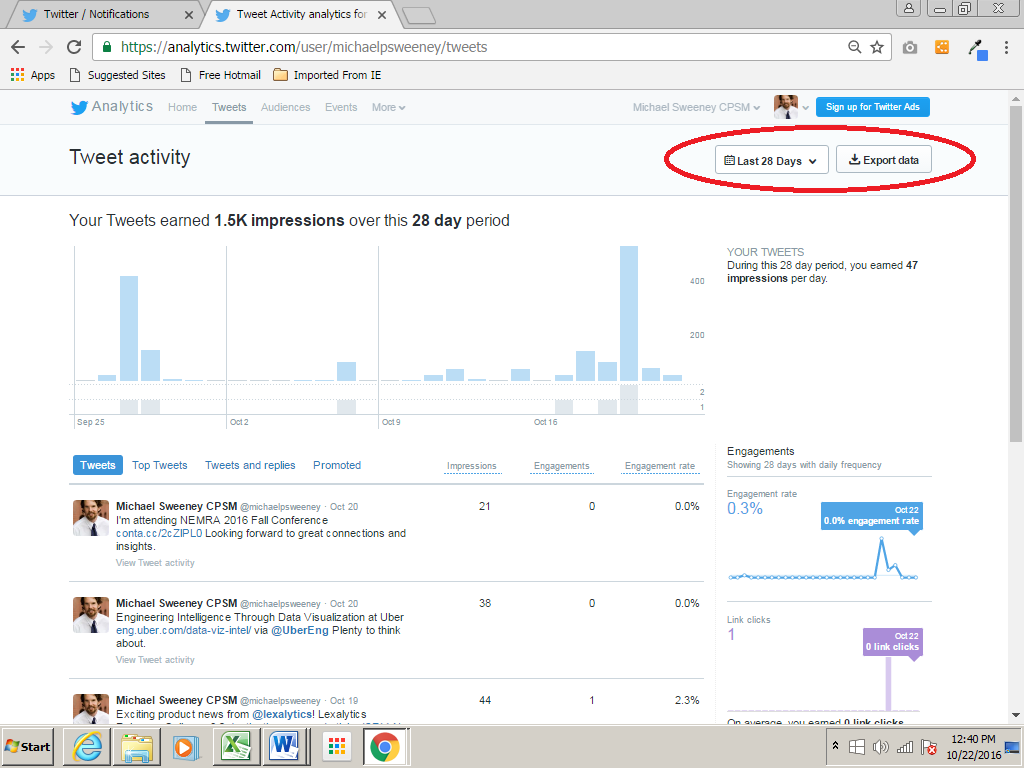
Twitter Analytics shows you a screen of column and line charts that aren’t much to look at, and provide little value for the screen space they occupy. When you download your tweets to a comma-separated values (CSV) file, you will first see columns of mostly zeroes spread over several screens. You can then combine and analyze these data in different ways.
Since my tweet activity was low (only 108 tweets, but still almost doubling 2015’s total of 69), analysis was manageable. My tweets by quarter were 37, 28, 17, and 26. I split engagement totals for tweets across four bands: the non-performers (zero engagements), the low performers (1-2), the middle performers (3-5), and the high performers (7-9).
Here’s a stacked column chart that shows the differences in the composition of the engagement number.
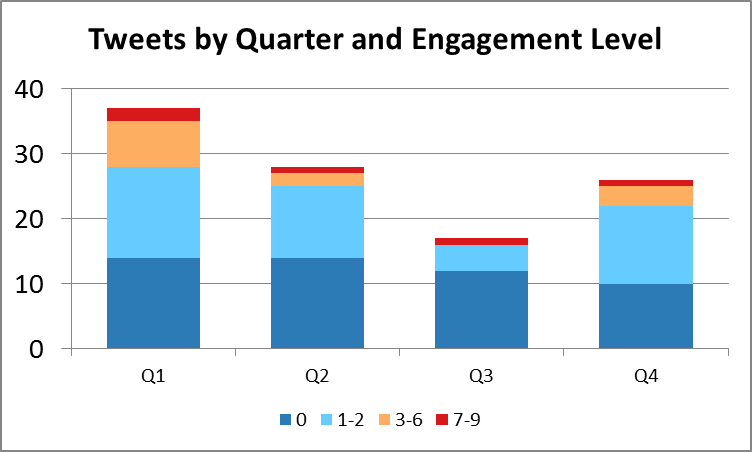
There were five high performers (less than 5% of the total) and 12 medium performers (less than 11%). Half of the year’s tweets had zero engagements.
High Performers: Head and Shoulders Above The Rest
My best performing tweet of the year, surprisingly, did not include links, photos, or video, and included only one hashtag. (And it was sent from my mobile phone):
A content strategy you can execute on Day 365 beats what you can do on Day One #gilbane — Michael Sweeney CPSM (@michaelpsweeney) November 29, 2016
I sent it during the opening keynote session of the Gilbane Conference. I used the #gilbane hashtag in a couple other tweets posted during the conference, but they were posted after hours, so people weren’t searching on that hashtag then. These were retweeted by the Gilbane Conference account, which has over four thousand followers.
My best performers were tweets where I tagged people. The engagement actions came from the people I tagged and their connections. All but one of these tweets centered around the Gilbane Conference community.
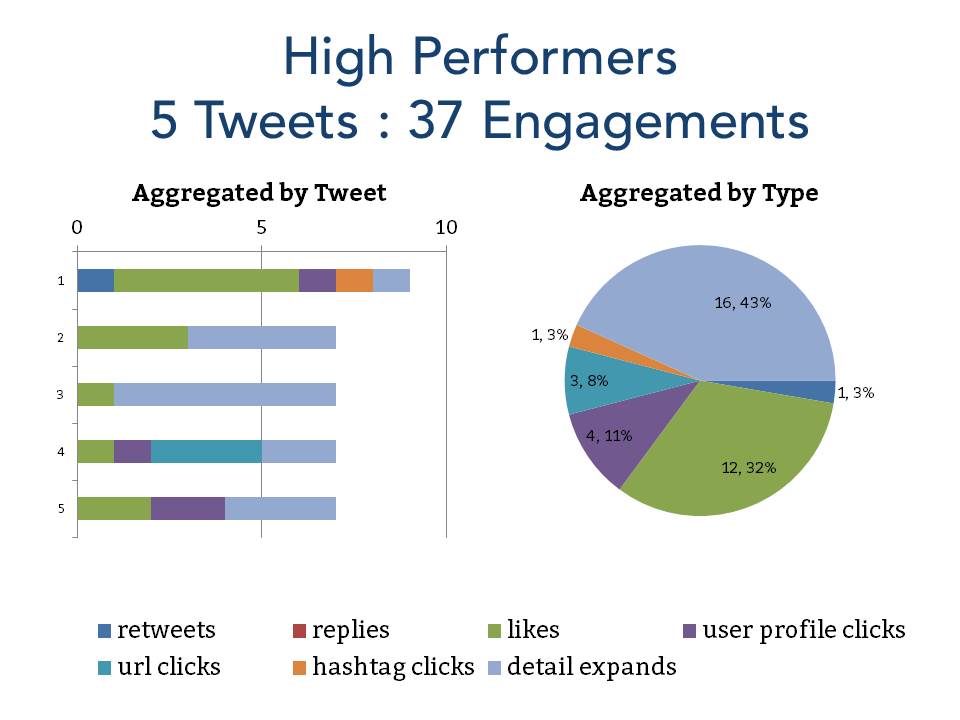
The top tweet that received URL clicks was a satirical Buzzfeed article I shared entitled, “If Hermione Were The Main Character In ‘Harry Potter'”. A mid-level tweet that received URL clicks was one of my own posts on LinkedIn, “3 Social Media Questions Busy AEC Marketers Won’t Ask (But Should)”. Ironic, no?
The top performing tweet featuring a meme I made (shown above) was posted for a laugh in reply to a friend’s tweet. That got a high engagement count because of the detail expansions (although it’s entirely possible that I made some of those clicks myself).
I also suspect that multiple engagement actions were taken by a single person.
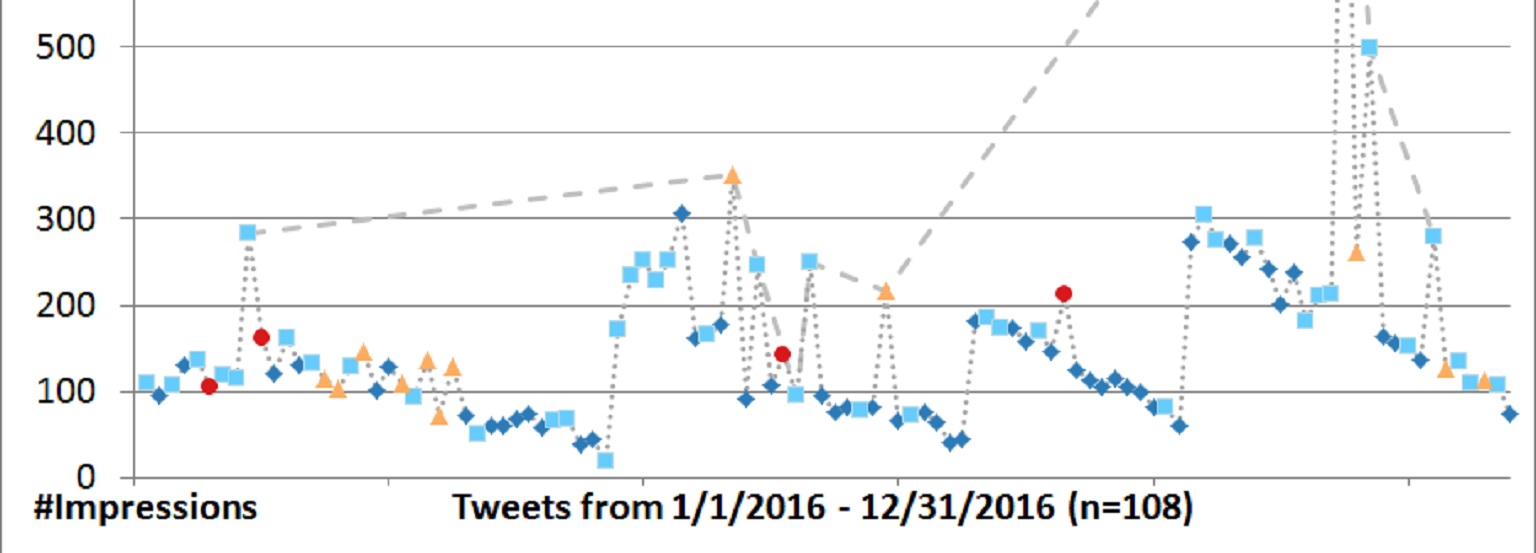
Impressions, Engagements, and How They Relate
Engagements cannot happen without impressions (views). But the tweet with by far the most views (945) and the most engagements (9) got one of the lowest engagement rates above zero (<0.01). This one was retweeted by an account with a large following, and that may have significantly boosted the impressions it got. Engagements and impressions form a virtuous circle.
Retweets, user_profile_clicks, and url_clicks are the most important engagements.
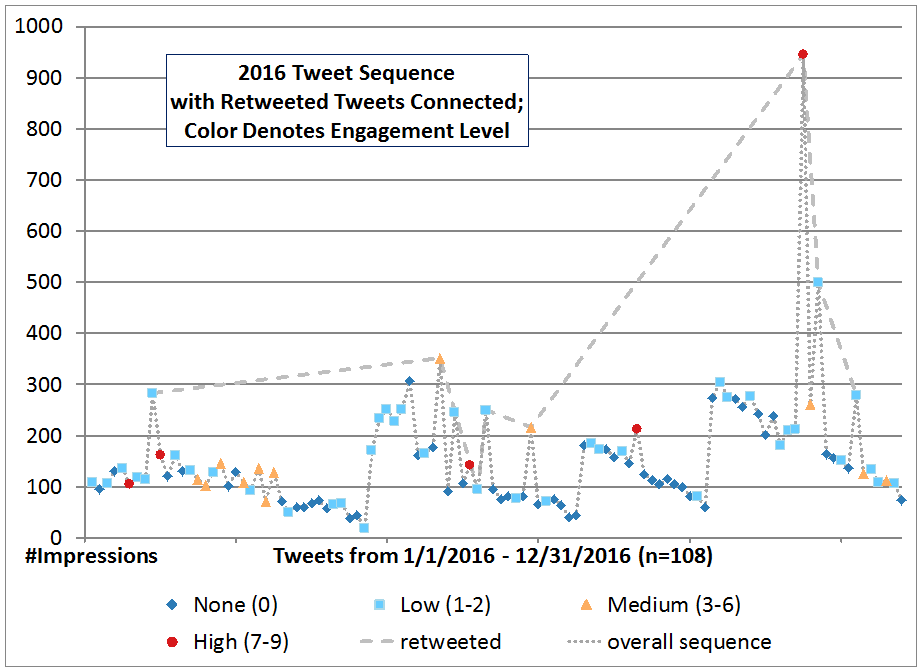
Visualizing the data this way shows a lot of interesting things. Coloring the nodes based on their engagement level shows that high engagement doesn’t depend on impressions; in all cases, a single retweet uniformly resulted in more impressions. We don’t know why impression counts seem to sawtooth, or why there are clusters of tweets that get more engagement and impressions than others.
But as we go forward, we will now have a baseline for experimenting with what and when we tweet, to better understand how Twitter can advance our business goals, one tweet at a time.
What are your experiences? Do these findings echo your own understanding of social media engagement? How do you make sure your social media habits align with your strategic goals?
Would you like to get more visibility and insight onto your Twitter presence and habits? Whether you tweet daily or hourly, Design-product Systems can develop a customized data visualization of your Twitter data. Download your Twitter activity today, and contact us about a smarter view of your activity that will help you modify your behavior to better drive engagement on this still-vibrant social media platform. Contact us today!
Michael, thanks for sharing this. I was starting to feel ambivalent toward Twitter, but your article has inspired me to take a second look.